
Blog Post Test
A common question that I receive from clients is whether or not our local real estate market is continuing its decreasing trend after the initial pandemic years. To try answering this question and to provide some perspective, let’s review some of our market trends based on local charts.
The first chart from the local MLS Real Estate Board illustrates the behaviour of real estate prices since the beginning of the pandemic, including the median sales prices. The Municipality of Cobourg is shown in red, that of Brighton is in grey, Belleville is in yellow, and Quinte West is in blue:
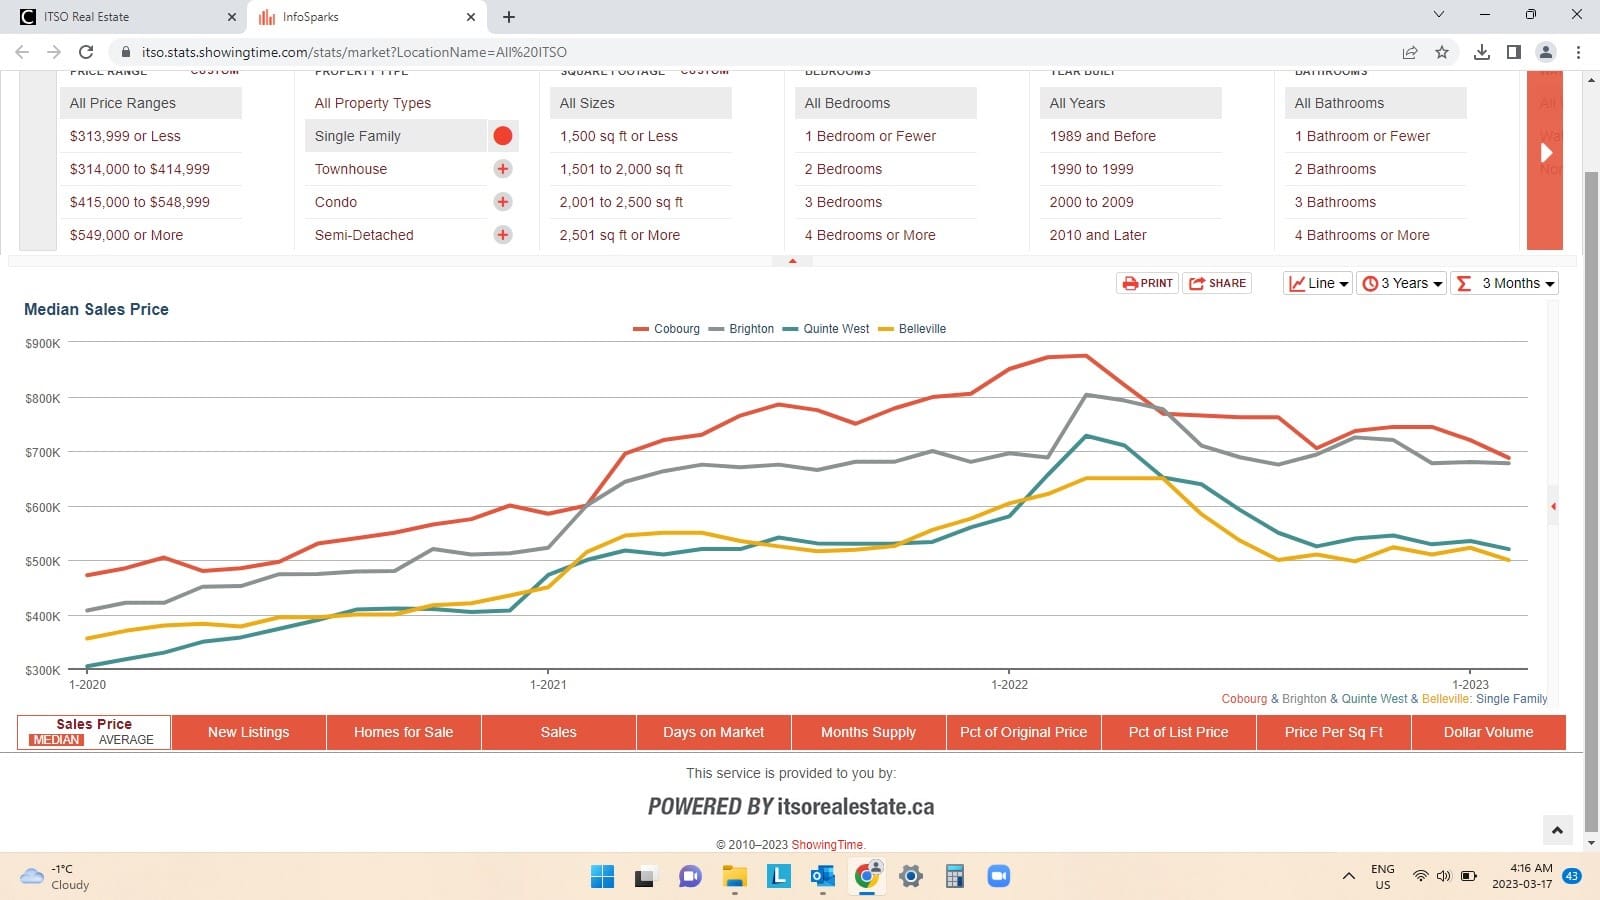
The chart shows the rising prices of single family homes from February 2020 to March 2022, when all the municipalities reached their highest peak. It also shows the decreasing trend in property prices in the last year, which coincided with the increase in interest rates by the Bank of Canada, designed in part to help to cool down real estate prices;
Despite the significant drop in 2022, prices have substantially increased over the last three years. From February 2020 to February 2023, property prices increased from a median of $485,000 to $687,500 in Cobourg, from $407,250 to $677,500 in Brighton, from $318,000 to $520,000 in Quinte West and from $370,000 to $500,000 in Belleville. As with many municipalities in Ontario, we have seen a significant increase in equity appreciation, which is good for homeowners who already own a house, yet not for those who are looking into getting into the market;
The February 2023 property values for the municipalities of Quinte West and Belleville are lower than those of Cobourg and Brighton (explained by their more rural tendency), which may make these municipalities very attractive and more affordable for buyers from out of town, as well as first-time buyers.
The second chart zooms in the behaviour of prices specifically for the last year, when prices started their decrease: